hubitat
Watchtower
Data-driven insights for a smarter home.
Watchtower is the all-in-one app for long-term smart home monitoring and data visualization.
Staying true to Hubitat’s core value, the application works 100% locally, without any dependence on the Internet or cloud services. Plus, you don’t have to fiddle with extra hardware like Raspberry Pi or NAS, or configure and maintain complex software like Docker containers, Prometheus, InfluxDB, Grafana, etc. Just install the Watchtower app on your Hubitat hub, and it seamlessly handles the rest.
Installation
Install using HPM
To install the Watchtower app using the Hubitat Package Manager (and receive automatic updates), follow these steps:
- Go to the Apps menu in the Hubitat interface.
- Select Hubitat Package Manager from the list of apps.
- In the top-right, make sure that you have at least version 1.9.2 installed; otherwise, first update HPM to its latest version.
- Click Install and then Search by Keywords.
- Type Watchtower in the search box and click Next.
- Choose Watchtower by Dan Danache and click Next.
- Read the license agreement and click Next.
- Wait for the installation to complete and click Next.
Manual install
Add application code
- Go to the Apps code menu entry in the Hubitat interface.
- Click the + New app button in the top right.
- Click the Import button in the top right.
- Insert the following URL:
https://raw.githubusercontent.com/dan-danache/hubitat/main/watchtower-app/watchtower.groovy - Click Import and then OK when prompted.
- Click the Save button in the top right.
- Click the OAuth button in the top right.
- Click the Enable OAuth in App button.
- Click the Update button in the bottom right.
Add dashboard resource files
- Download the watchtower.html file from GitHub on your Desktop.
- Download the watchtower.js file from GitHub on your Desktop.
- Go to the Settings menu entry in the Hubitat interface.
- Select File Manager from the list.
- Click the + Choose button.
- Locate and select the watchtower.html file from your Desktop.
- Click the Upload button.
- Click the + Choose button.
- Locate and select the watchtower.js file from your Desktop.
- Click the Upload button.
Create application instance
- Go to the Apps menu entry in the Hubitat interface.
- Click the + Add user app button in the top right.
- Select Watchtower x.y.z from the list.
Start the application
- Go to the Apps menu entry in the Hubitat interface.
- Select Watchtower x.y.z from the apps list.
Metrics Collection
The application utilizes a fixed-size database, similar in design and purpose to an RRD (Round-Robin Database). This setup allows for high-resolution data (minutes per point) to gradually degrade into lower resolutions for long-term retention of historical data.
The following time resolution are used:
- 5 minutes: Attribute value in the last 5 minutes
- 1 hour: Average attribute value over the last hour
- 1 day: Average attribute value over the last day
- 1 week: Average attribute value over the last week
How it Works
-
Every 5 minutes: The application calculates the 5-minutes value for all configured device attributes and stores this data in the File Manager using CSV files named
wt_${device_id}_5m.csv, one file per configured device. Only devices configured in the application’s Devices screen are queried. -
At the start of every hour: The application reads the data from each device’s
wt_${device_id}_5m.csvfile, selects records from the last hour, calculates the averages, and saves them in CSV files namedwt_${device_id}_1h.csv. -
At midnight daily: The application reads the data from each device’s
wt_${device_id}_5m.csvfile, selects records from the last day (00:00 - 23:59), calculates the averages, and saves them in CSV files namedwt_${device_id}_1d.csv. -
At midnight every Sunday: The application reads the data from each device’s
wt_${device_id}_1h.csvfile, selects records from the last week (Monday 00:00 - Sunday 23:59), calculates the averages, and saves them in CSV files namedwt_${device_id}_1w.csv.
Note: To maintain a fixed file size, old records are discarded during each save, as specified in the Settings screen.
Handling attribute values for powered-off devices
Certain mains-powered devices, such as light bulbs or air purifiers, can be turned off. When these devices are off, the values of other attributes remain unchanged, which can lead to invalid data being recorded. To prevent this, the following attributes will be recorded as null when the device has a switch attribute set to off:
Standard attributes:
- airQualityIndex
- amperage (A)
- carbonDioxide (ppm)
- humidity (%)
- illuminance (lx)
- level (%)
- pH (pH)
- power (W)
- rate (LPM)
- temperature (°C or °F)
- ultravioletIndex
Custom attributes:
- cloudiness (%)
- pm10 (μg/m3)
- pm25 (μg/m3)
- vocIndex
- windDirection (°)
- windGust (km/h or mph)
- windSpeed (km/h or mph)
Handling of Min/Max Values
For certain attributes, such as temperature and humidity, storing only the 1-hour, 1-day, or 1-week averages may not provide a complete picture. Therefore, the application also automatically records the minimum and maximum values for these intervals in the CSV files.
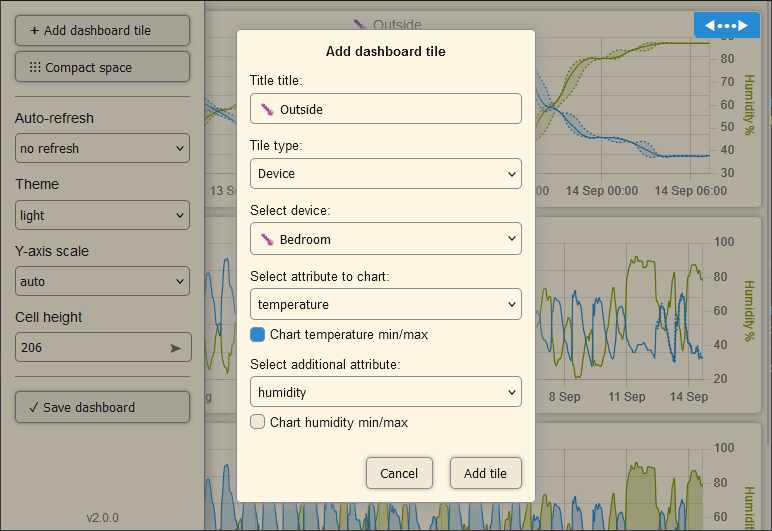
These min/max values can be visualized in a chart using the Device tile. When configuring the tile, if a supported device attribute is selected, the “Chart attribute min/max” option becomes available:
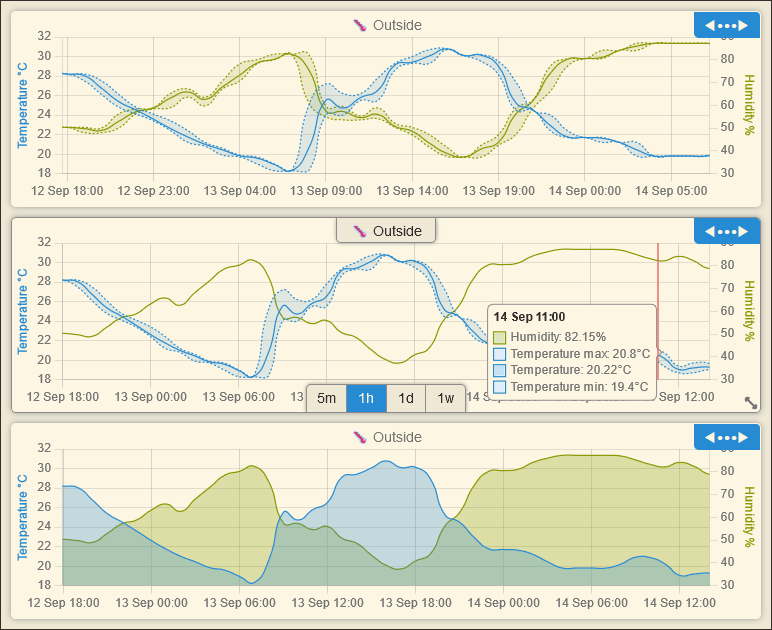
Once the chart is rendered, the min/max values are displayed:
Note: Min/max values are charted only when the 1-hour, 1-day, or 1-week time resolutions are selected.
In the example above (1-hour time resolution):
- The top tile displays the min/max values for both temperature and humidity.
- The middle tile displays the min/max values only for temperature.
- The bottom tile displays temperature and humidity without the min/max values.
Usage
To use the Watchtower app, follow these steps:
- Go to the Apps menu in the Hubitat interface.
- Select Watchtower from the list of apps.
Main Screen
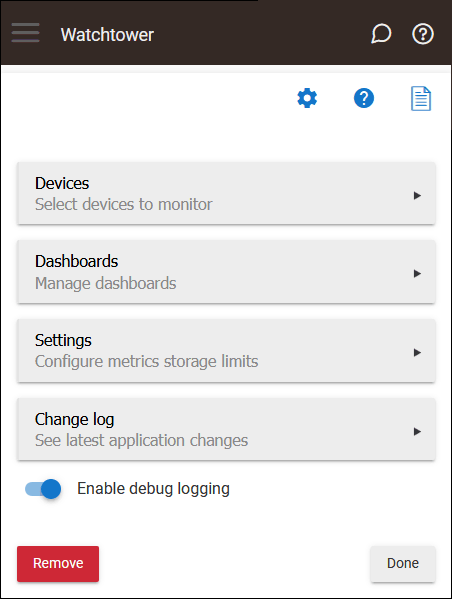
When you open the Watchtower app, the following screen will welcome you.
Devices Screen
On this screen, you can configure which smart devices will be monitored by the Watchtower app.
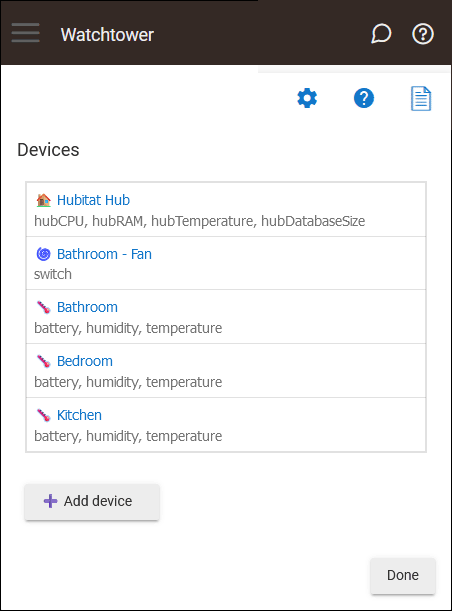
Click the Add device configuration button to start monitoring a new device. You will be prompted to select a device and then select what device attributes (from device Current State) you want to monitor.
Note: Not all device attributes are supported. Only the official attributes will be available for selection.
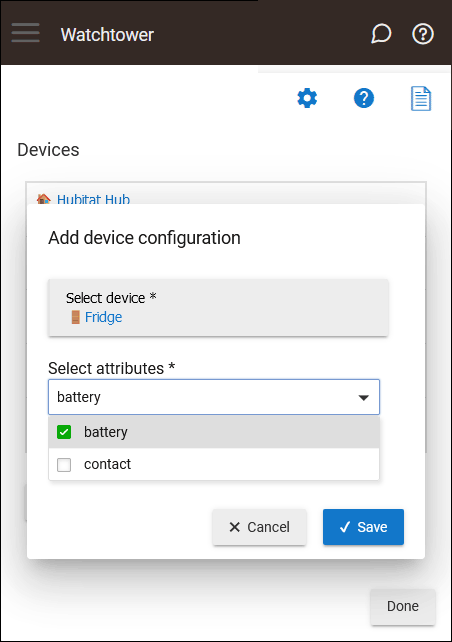
After you click the Save button, the application will start to periodically (every 5 minutes) save the selected attributes in a CSV file that you can download from the File Manager.
Links to the CSV files are available from the View device screen.
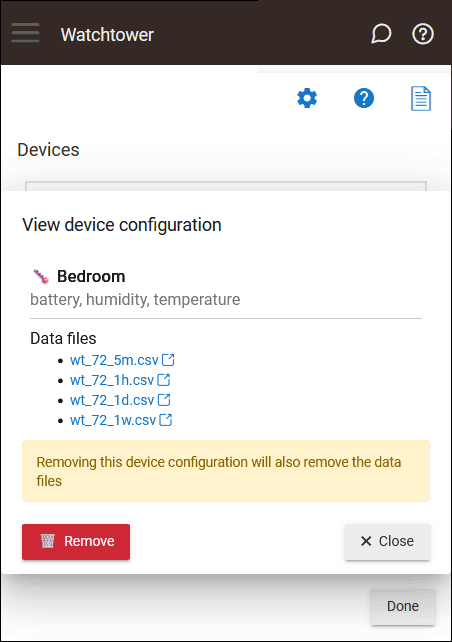
From this screen, you also have the option to remove the device configuration. Once you click the Remove button, the application will stop collecting metrics for this device. The CSV files are also removed from the File Manager.
Dashboards Screen
From the dashboards screen, you can add, rename and delete dashboards for the configured devices. Clicking the dashboard name, will open the specified dashboard in a new tab and you can add and remove tiles for the selected dashboard.
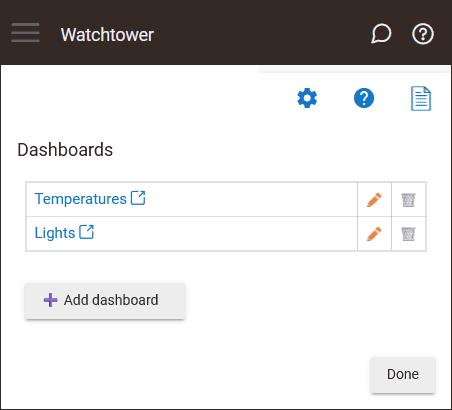
Click the Done button on the bottom-right to return back to the main screen.
Settings Screen
From the settings screen, you can configure how long the collected metrics are stored for each time resolution.
Caution: Changing the “max record” settings will directly impact the CSV files size for every configured device. Loading of dashboard tiles will also be slower if you increase the default values since more data needs to be downloaded from the hub.
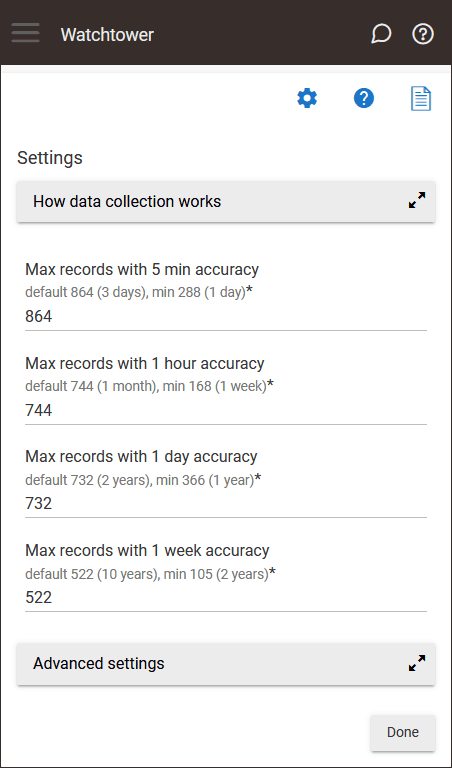
Click the Done button on the bottom-right to save the configuration and return back to the main screen.
Dashboard Configuration
When you load a dashboard in a new tab for the first time (by clicking the dashboard name in the Watchtower app), a blank screen will appear where you can add multiple tiles.
Note: If you have just configured new monitored devices in the Watchtower app, there may not be enough data collected to display on the dashboard tiles. If a chart displays the No data yet message, don’t worry. Simply check back later (e.g., in a day or two) to allow the application to collect sufficient data points.
Dashboard Menu
The dashboard menu is not displayed by default and will only appear when the dashboard has no tiles. To toggle the dashboard menu, press the ESC (Escape) key on your keyboard. On touchscreen devices, you can bring up the menu by swiping from the left margin of the screen.
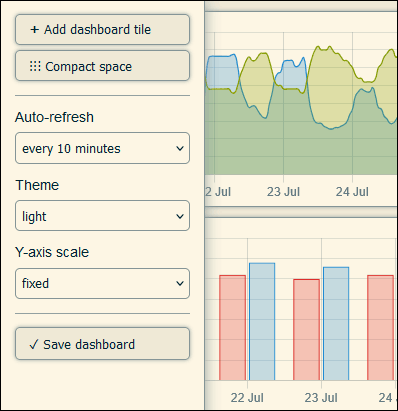
From the dashboard menu on the left, you can add a new dashboard tile, save the current dashboard layout, or configure the auto-refresh interval.
Important: Changes to the dashboard layout are not saved automatically! When you are satisfied with the dashboard layout, you must click the Save dashboard button.
Supported Dashboard Tiles
The following dashboard tile types are currently supported:
-
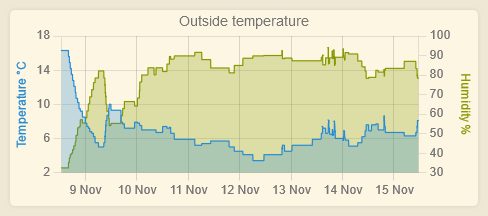
Singe Device - Renders a chart with one or two attributes for the selected device. If you select a second attribute, its scale is shown on the right side of the chart.
Example usage: chart temperature and humidity for a specific device.
-
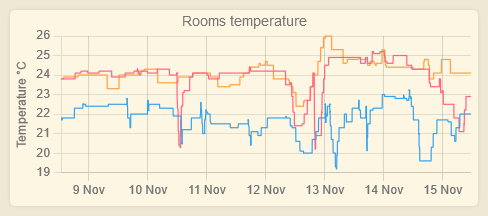
Singe Attribute - Renders a chart with the selected attribute, from multiple devices.
Example usage: chart temperature for 2 devices (inside vs. outside).
-
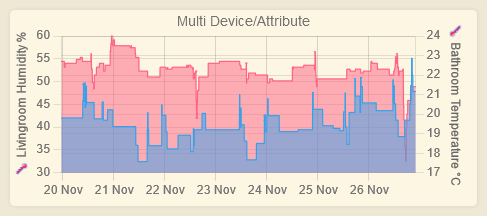
Multi Device/Attribute - Renders a chart with multiple attributes from multiple devices.
Example usage: chart temperature for one device and switch status from another device.
-
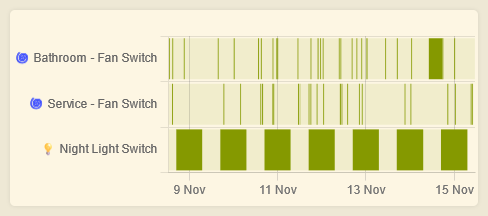
Status Map - Renders a status/heatmap chart with multiple attribute from multiple devices.
Example usage: chart the switch status (on/off) for multiple devices.
-
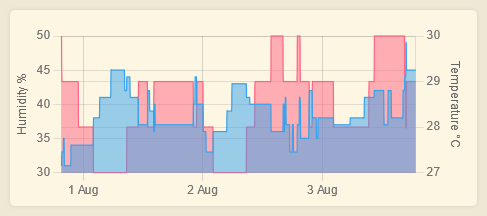
Bring Your Own Data - Renders a chart with data from a CSV or JSON file (hosted in the Hubitat File Manager) that is not managed by the Watchtower app.
-
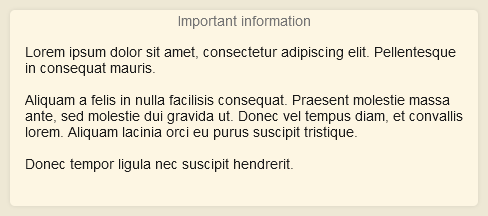
Text - This tile type renders plain or HTML text.
Example usage: add a navigation tile with links to other dashboards (using HTML code).
-
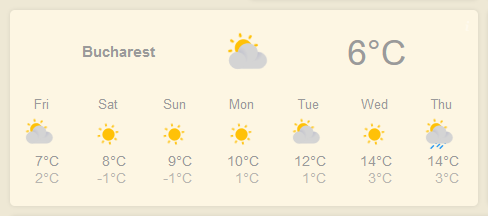
Iframe - This tile type renders an embedded web page from a specified URL.
Example usage: load a widget (clock, weather, video feed, etc.) from another location.
-
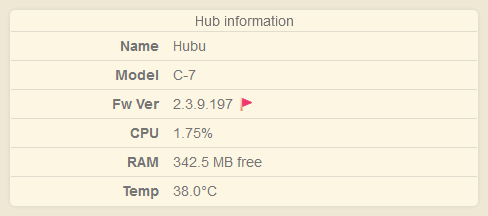
Hub Info - This tile type renders information about the Hubitat hub.
Manage Dashboard Tiles
-
Rearrange tiles by dragging their title. Resize tiles by dragging the bottom-right corner.
-
Remove tiles by moving them outside the dashboard grid.
Important: Changes are not automatically saved! Remember to click the Save dashboard button when you are satisfied with the dashboard layout.
Chart Time Resolution
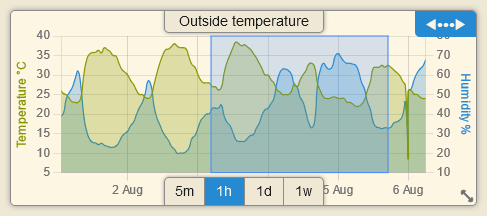
When you move your mouse over a chart, the time resolution picker is displayed at the bottom. You can switch between 5-minute, 1-hour, 1-day, and 1-week resolutions.
Changing the time resolution updates the source of the graph data points. For example, selecting the “1h” resolution loads chart data from the wt_${device_id}_1h.csv file in the File Manager.
Chart Zoom
The zoom functionality allows you to interact with charts displaying multiple data points over time. To zoom in on a specific chart area, simply select it using your mouse. To return to the full dataset view, click the Reset Zoom button (◀•••▶) in the top right corner.
If the CTRL key is pressed during selection or while clicking the Reset Zoom button (◀•••▶), then the zoom/reset zoom will be synced between all dashboard charts.
On touchscreen devices, start by tapping the chart briefly, then immediately drag the desired chart area to zoom in. The sync functionality is not available on touchscreen devices.
Auto-refresh
Using the left dashboard menu, select the desired auto-refresh interval.
Themes Support
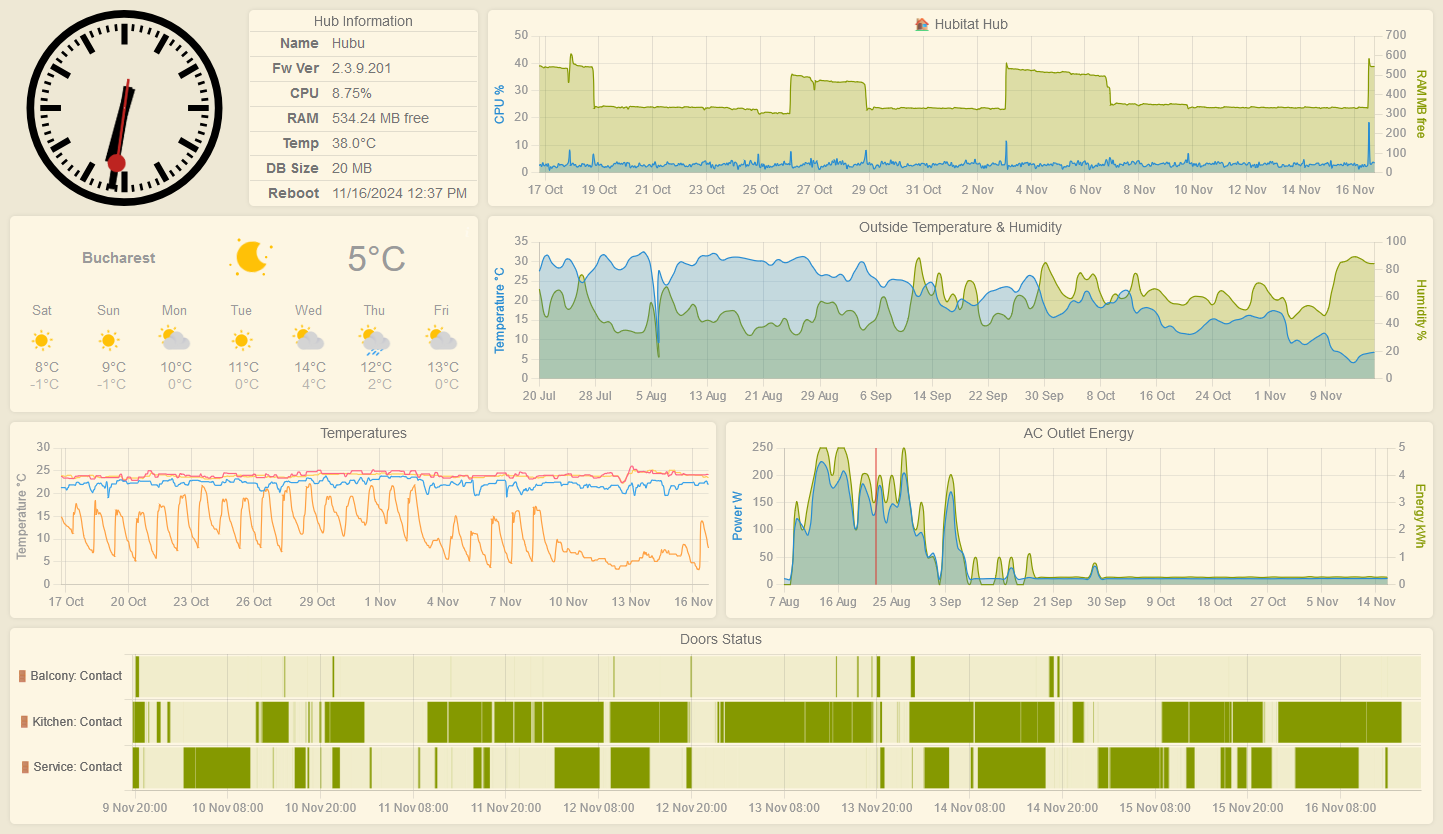
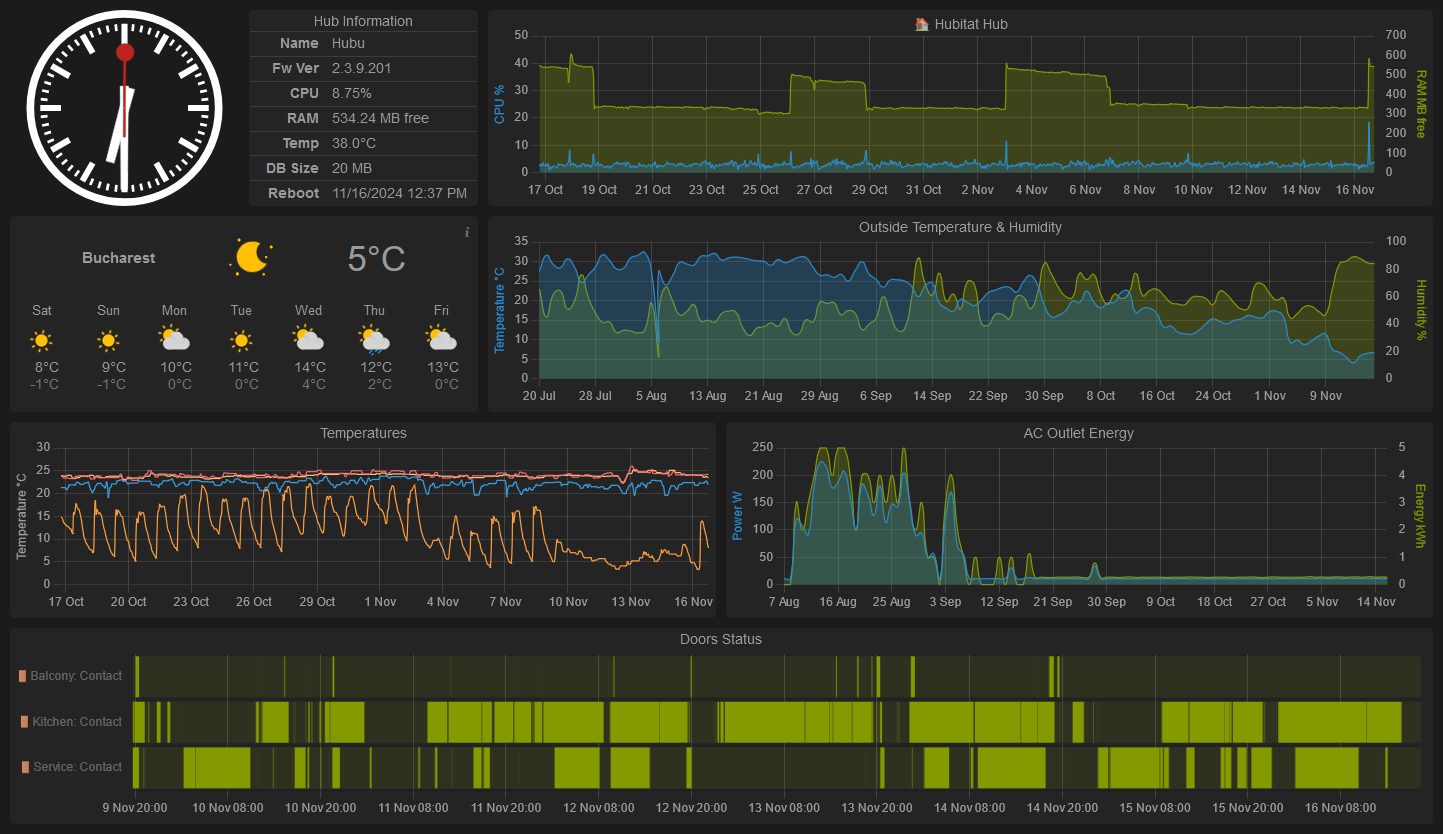
Dashboards can be configured to use a light or dark theme. You can change the theme from the dashboard menu.
Advanced Usage
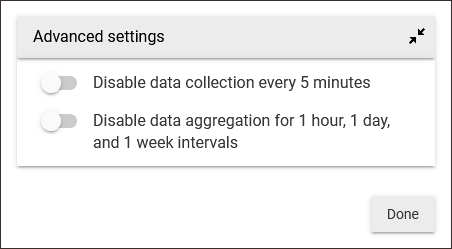
Disable Automatic Data Collection
Although strongly discouraged, you have the option to disable data collection and data aggregation processes (which run as scheduled tasks on the hub) from the Settings screen.
On-demand Data Collection
The data collection process runs automatically every 5 minutes. To initiate on-demand data collection (e.g., from Rule Machine) for all configured devices, execute the following HTTP GET request against your hub’s IP address:
GET /apps/api/${app_id}/collect-device-metrics?access_token=${access_token}&lookbackMinutes=${lookbackMinutes}
| Parameter | Format | Description |
|---|---|---|
| app_id | number, required | Watchtower app ID. Get this from the URL when the app is opened in Hubitat. |
| access_token | string, required | Watchtower app Access Token. Get this from the URL when you load a Watchtower dashboard. |
| lookbackMinutes | number, optional | How far back in time to look for device events when calculating the current data point (min=0, max=30, default=0). |
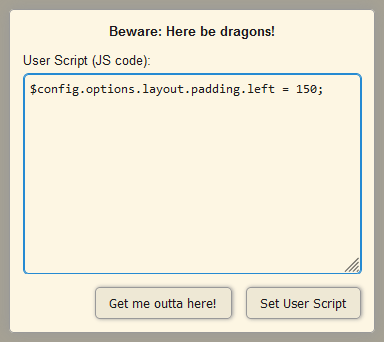
Chart User Script
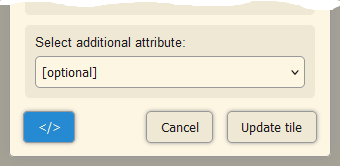
For tiles that render a chart, the User Script feature allows you to interact directly with the Chart.js configuration object. First click the </> button:
Then you can modify the Chart.js configuration object ($config) using JavaScript code:
Check out the Chart.js documentation to find more about the configuration object structure.
User Script Examples
Add left padding for the chart:
$config.options.layout.padding.left = 150;
Display the chart legend:
$config.options.plugins.legend.display = true;
Change the scale label for the first device attribute:
$config.options.scales.attr1.title.text = 'Rain Rate mm/h';
Change the line and area color of the first dataset to red (#FF0000):
$config.data.datasets[0].borderColor = '#FF0000';
$config.data.datasets[0].backgroundColor = '#FF000022';
Add a chart title:
$config.options.plugins.title = {display:true, text:'Heating'};
Stack the charts of a device type tile with 2 attributes selected:
$config.options.scales.attr1.stack = 'stack';
$config.options.scales.attr1.stackWeight = 2;
$config.options.scales.attr2.stack = 'stack';
$config.options.scales.attr2.stackWeight = 1;
$config.options.scales.attr2.offset = true;
$config.options.scales.attr2.position = 'left';
Inspect the current chart configuration (output is found in the browser web console):
console.log($config);
